# Layers
Weacast includes a set of Leaflet (opens new window) layers to help visualize forecast data or probe results.
WARNING
In the legacy Weacast client module (opens new window) each layer type implements the TimeDimension Layer interface (opens new window). However, Weacast client module (opens new window) will not evolve anymore (see discussion here (opens new window)) and will only be maintained for the purpose of our demo application (opens new window). If you'd like to build client applications using Weacast you'd better have a look to our client API layer in core module (opens new window) and dedicated map engine modules like our Leaflet plugin (opens new window).
# Feature Layers
Time-stamped GeoJson layers (opens new window) provide a generic way to visualize GeoJSON features (opens new window) including temporal evolution. Because probes and probe results are internally modelled as GeoJSON features they can be used to visualize them. However Weacast does not make any assumption on how you want to visualize these data so you might have to manually process the retrieved probe results in order to add a time property on each feature corresponding to the forecastTime or the runTime for instance.
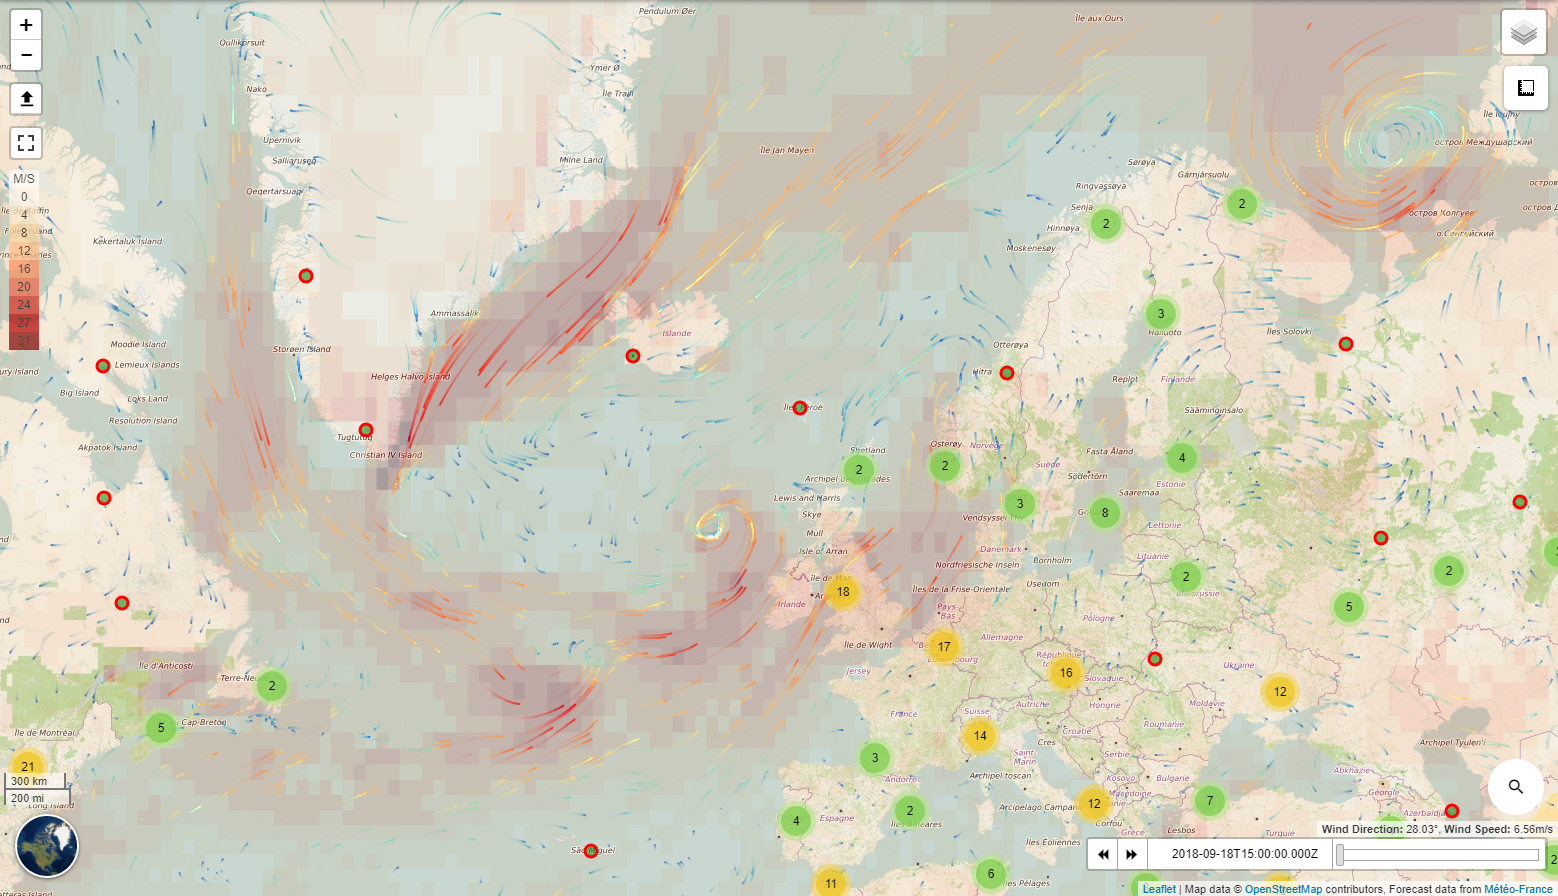
Using map mixins (opens new window) configuration options you can easily customize your probe results visualization to get something like this:
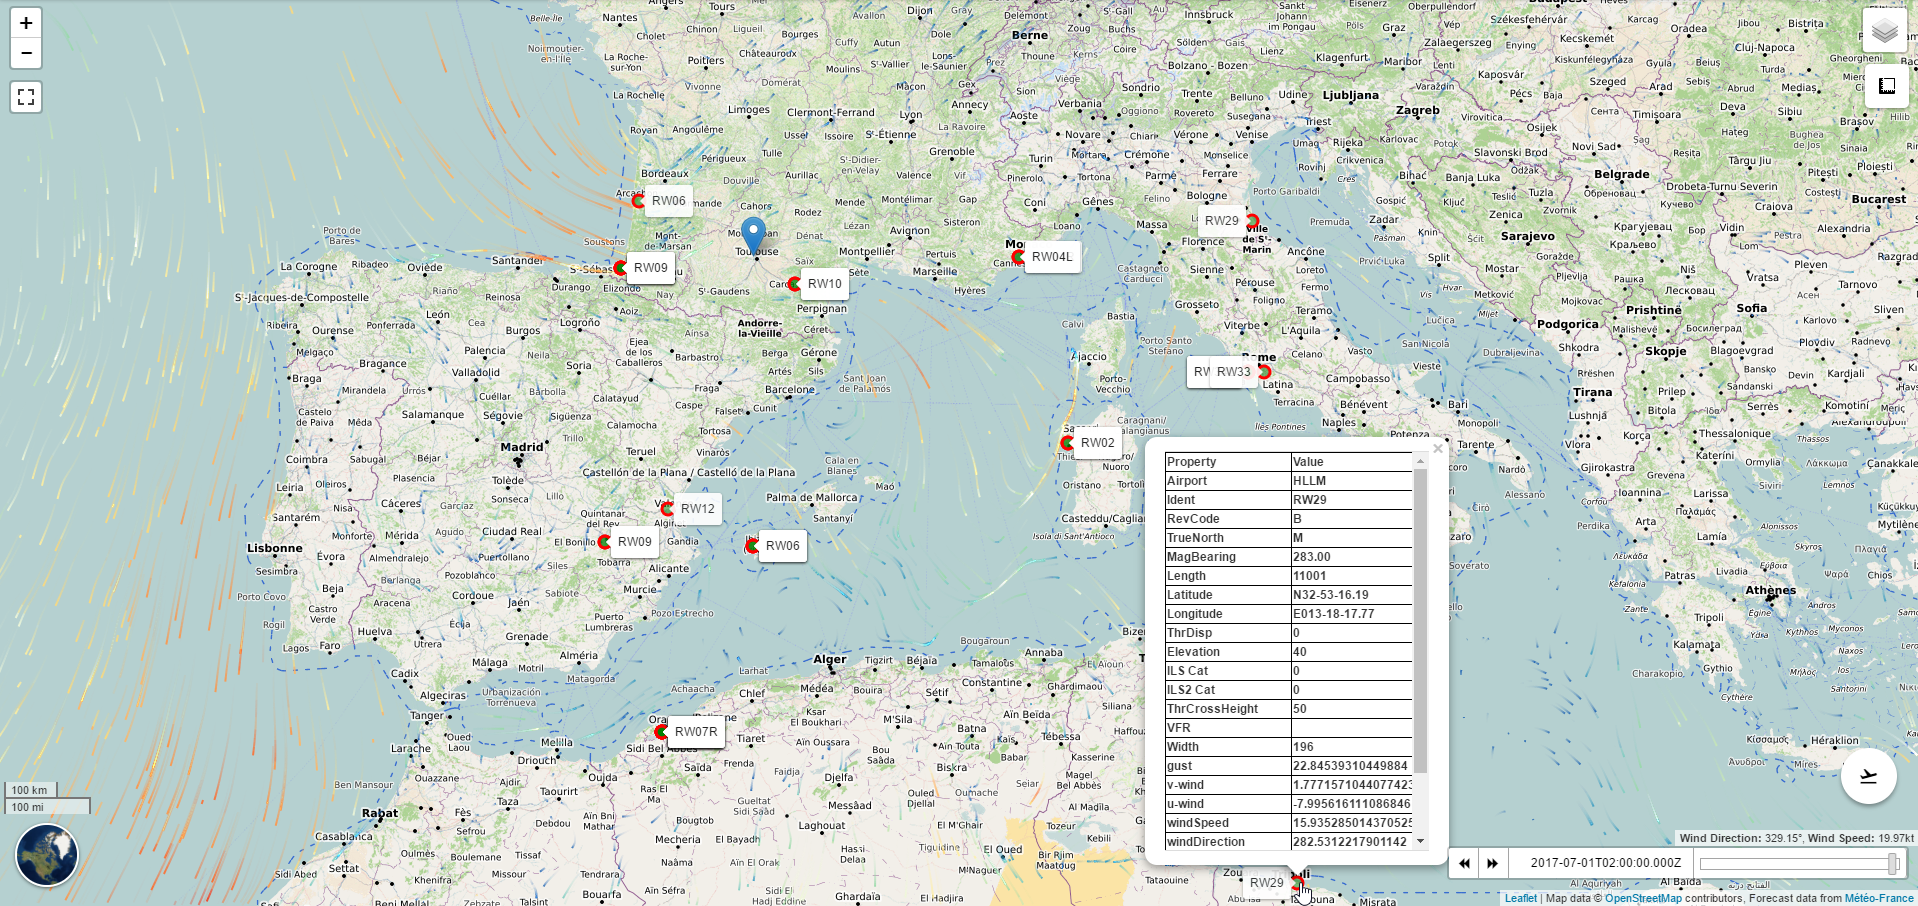
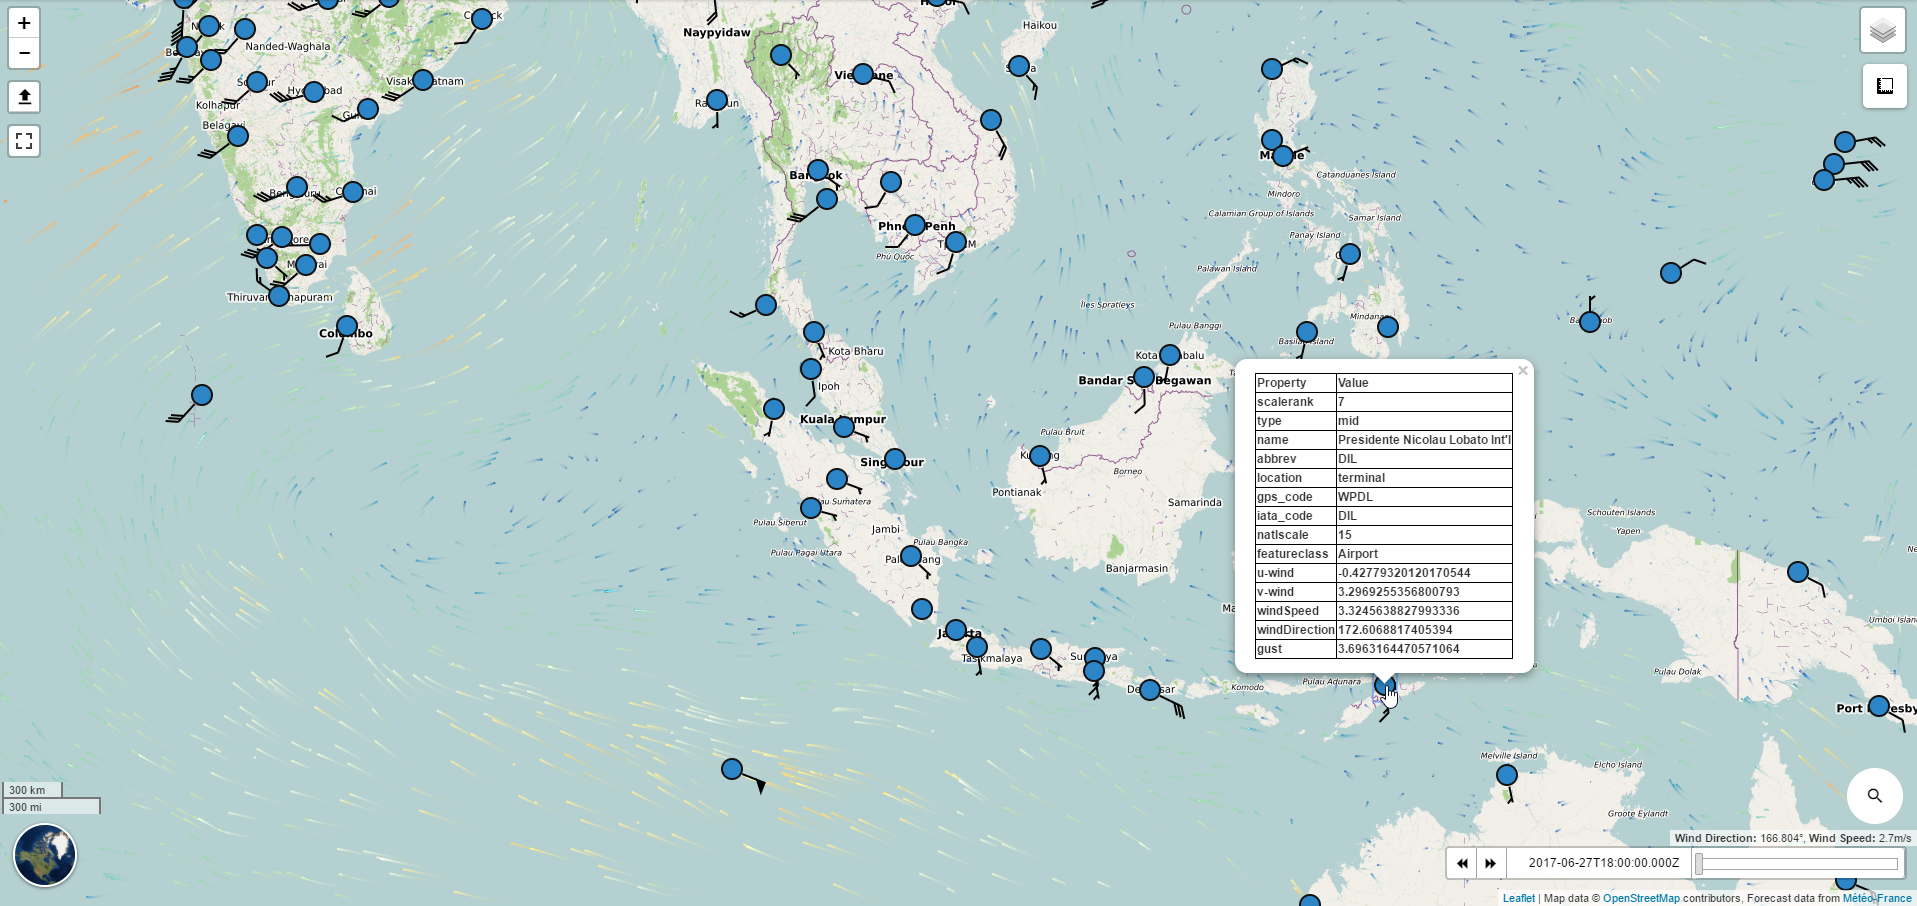
Weacast also provides a convenient wind barb (opens new window) icon based on leaflet-windbarb (opens new window) that can be used to symbolize wind like this:
# Forecast Data Layers
Weacast includes a set of Leaflet (opens new window) layers to manage the temporal evolution of forecast data. Due to the possible large amount of forecast data it is recommanded to load data on-demand, although it is possible to have an internal data cache.
# ForecastLayer source (opens new window)
Forecast layer interface implemented by all other types of layer, based on leaflet-timedimension (opens new window).
A Weacast layer of type ClassName are created like this (where app is the Weacast client app instance):
let layer = new L.Weacast.ClassName(app, {
  // Forecast element to be managed
  elements: ['u-wind', 'v-wind'],
  // Attribution
  attribution: 'Forecast data from <a href="http://www.meteofrance.com">Météo-France</a>'
})
# .setForecastModel (model)
Called by the map whenever the current forecast model changes, can be customized by child classes to do whatever required then.
# .fetchAvailableTimes()
Retrieve the forecast element available forecast times and configure the TimeDimension (opens new window) object of the map accordingly.
# .fetchData()
Retrieve the forecast element data for the currently configured time in the TimeDimension (opens new window) object of the map.
# .getQuery()
Build the query object to retrieve forecast element data, can be customized by child classes. By default create a query to retrieve data with the currently configured forecast model (i.e. bounds, resolution, etc.) and time in map.
# .setData(data)
To be implemented by child classes, data contains an array of data array for each configured forecast element in the layer.
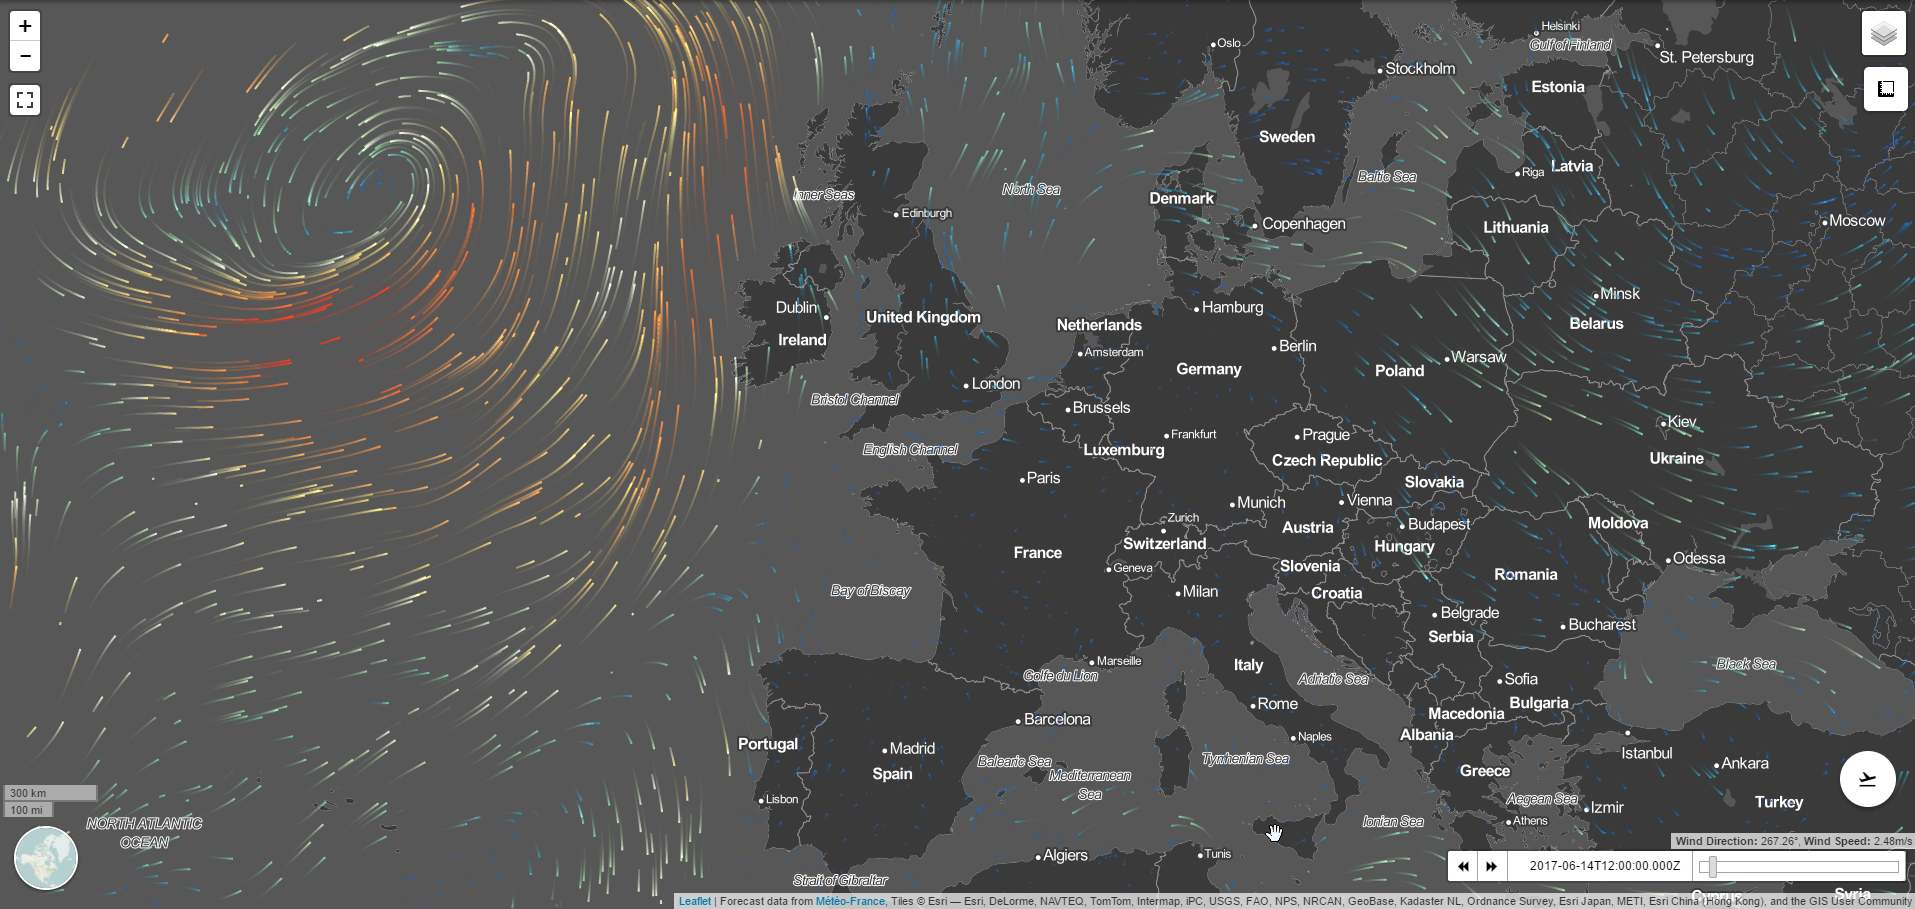
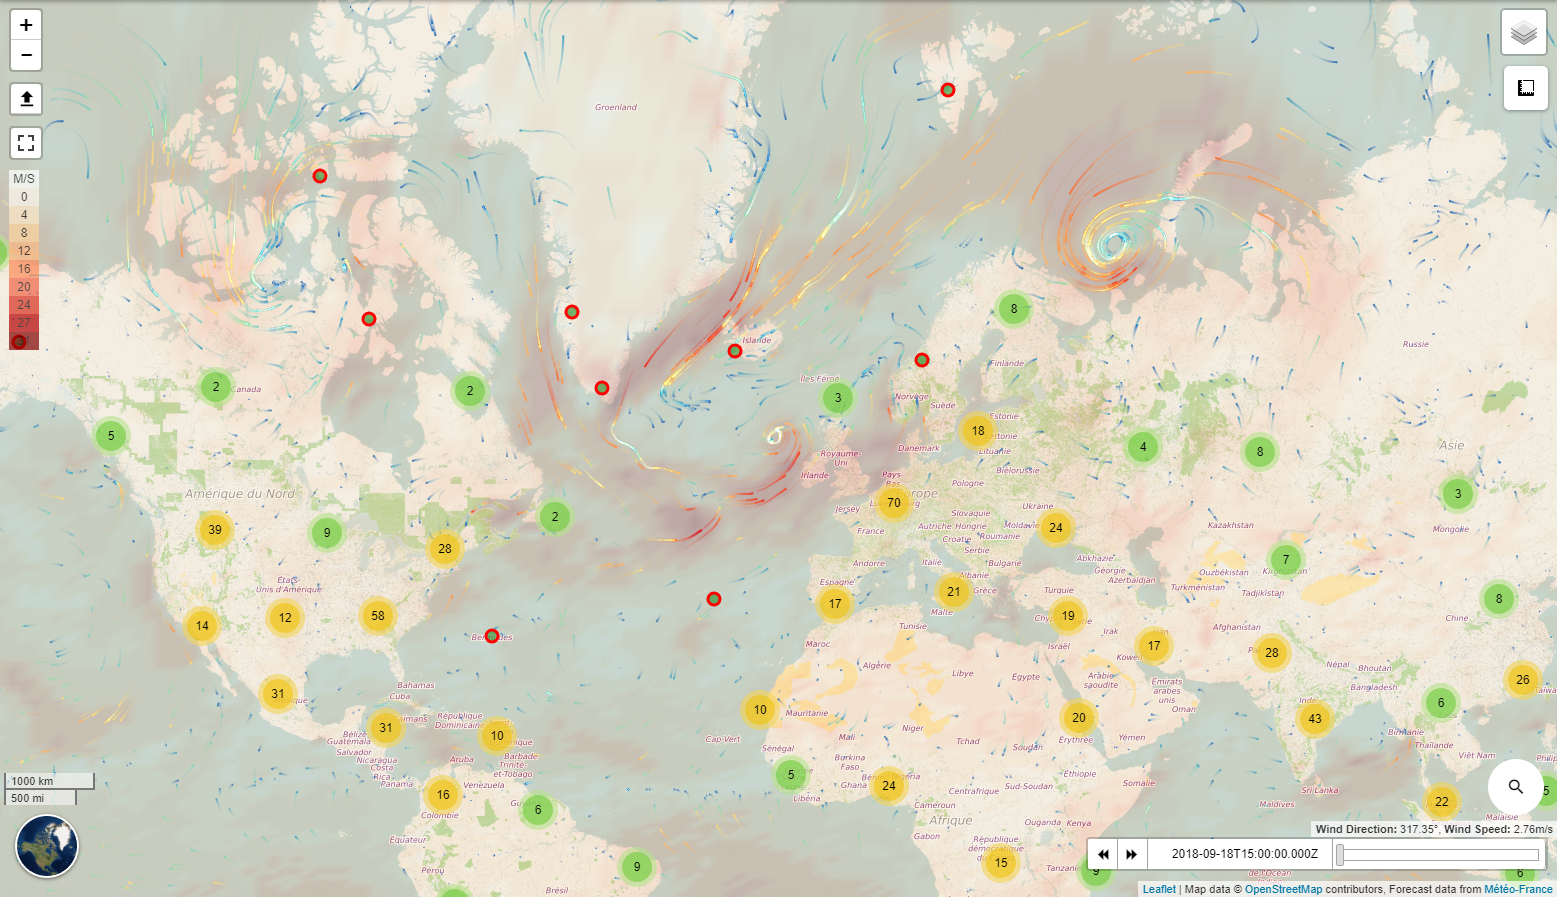
# FlowLayer source (opens new window)
To visualize forecast paired element as flow (e.g. wind direction), based on leaflet-velocity (opens new window).
# HeatLayer source (opens new window)
To visualize forecast element scalar values (e.g. temperature) as a heatmap, based on leaflet-heatmap (opens new window).
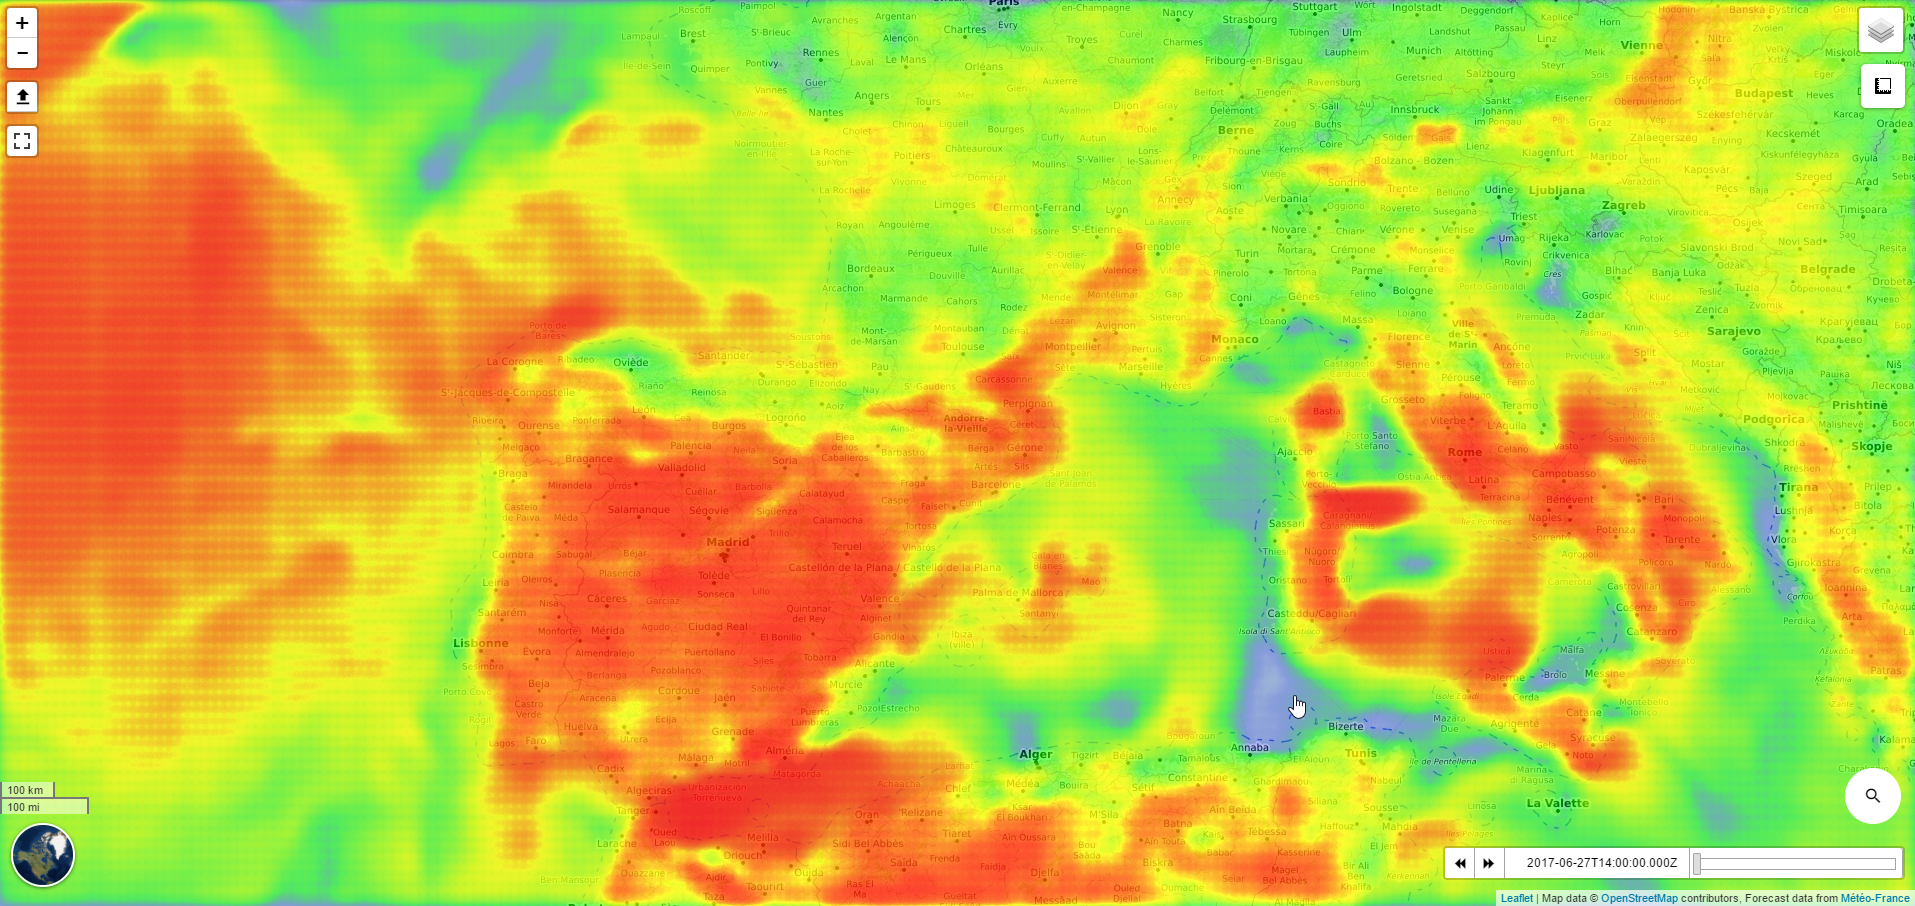
# ColorLayer source (opens new window)
DEPRECATED: use the ScalarLayer
To visualize forecast element scalar values (e.g. temperature) as a color image using color maps (opens new window), based on leaflet-canvaslayer-field (opens new window).
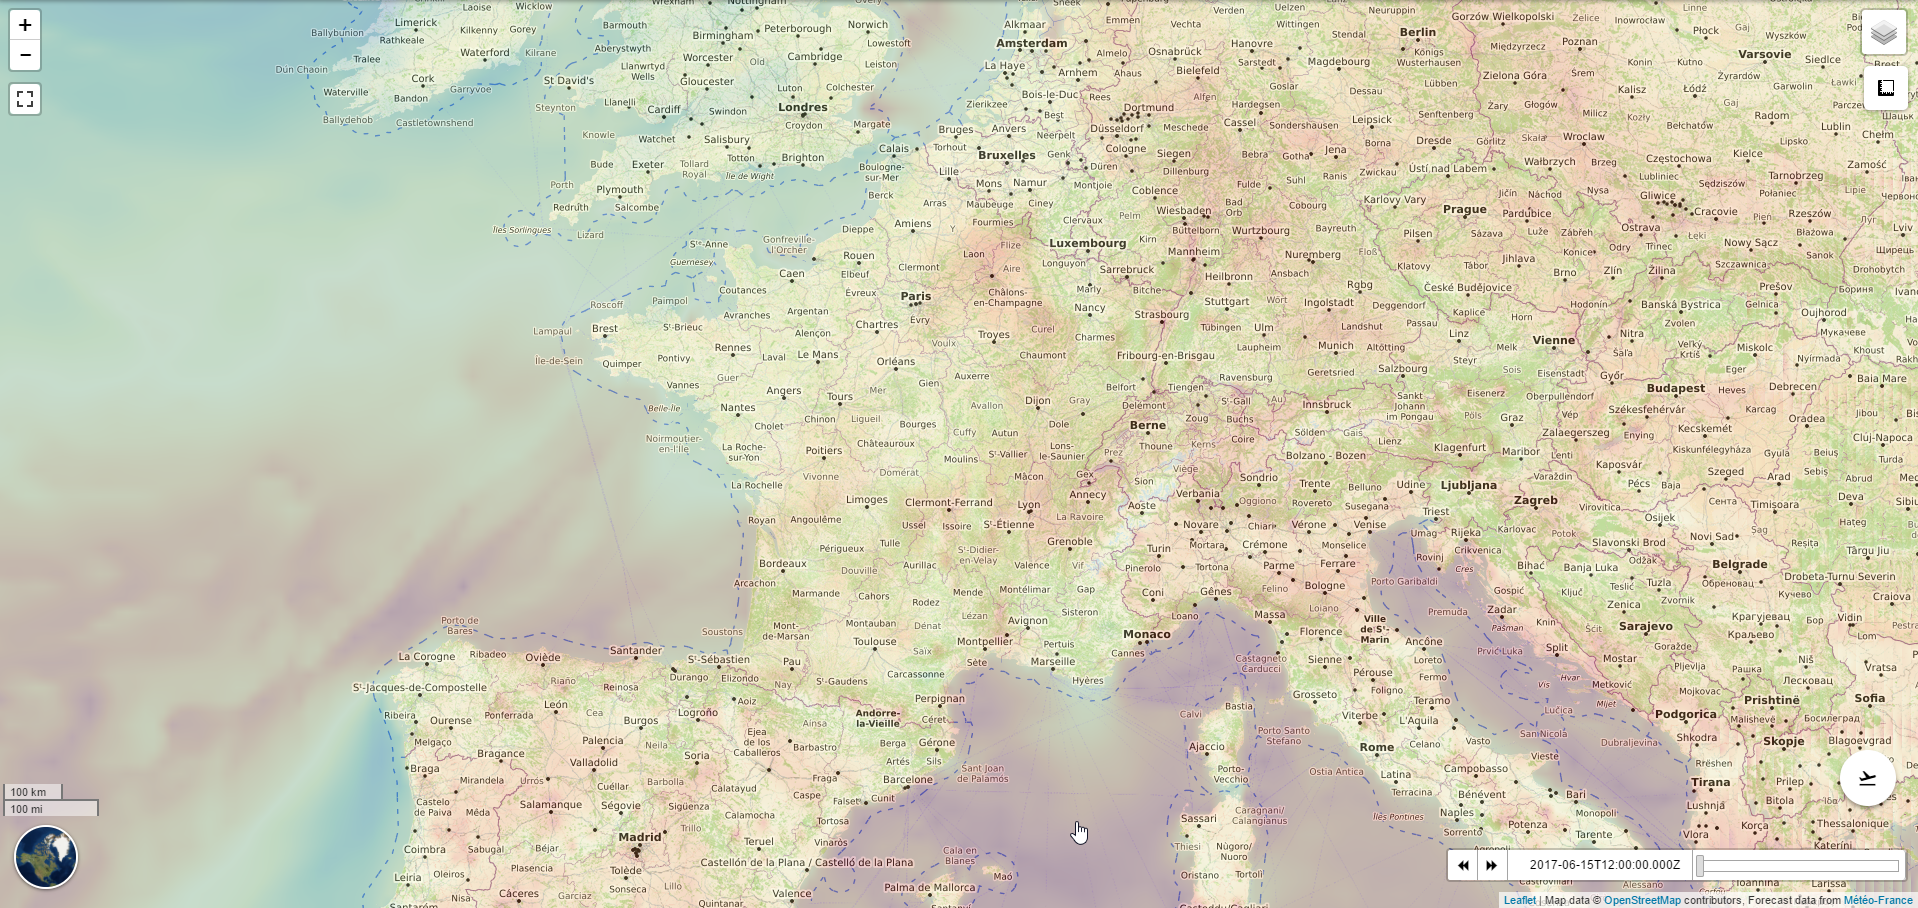
# ScalarLayer source (opens new window)
To visualize forecast element scalar values (e.g. temperature) as a structured mesh using color maps (opens new window), based on leaflet-pixi-overlay (opens new window). It provides 2 ways of rendering the data:
- As gridded based rendering to visualize the raw data. To each cell of the grid is assigned a data.
- An interpolated based rendering to visualize the data as color image.
← Alert plugin Mixins →